
15 Apr Canadian home sales edge higher in March 2019
Ottawa, ON, April 15, 2019 – Statistics released today by the Canadian Real Estate Association (CREA) show national home sales edged higher in March 2019 after having declined sharply the previous month.
Highlights:
- National home sales edged up 0.9% month-over-month (m-o-m) in March.
- Actual (not seasonally adjusted) activity was down 4.6% year-over-year (y-o-y).
- The number of newly listed homes rose 2.1% m-o-m.
- The MLS® Home Price Index (HPI) eased by 0.5% y-o-y in March.
- The national average sale price fell 1.8% y-o-y.
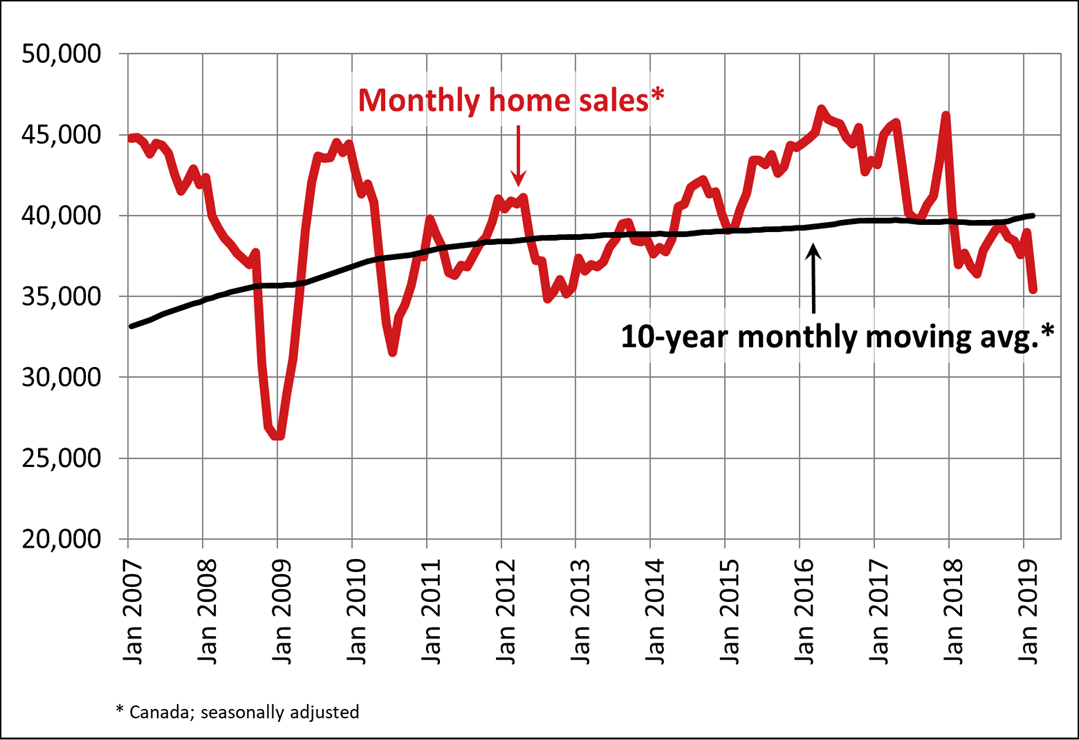
Home sales via Canadian MLS® Systems edged up 0.9% in March 2019 following a sharp drop in February, leaving activity near some of the lowest levels recorded in the last six years. (Chart A)
There was an even split between the number of markets where sales rose from the previous month and those where they waned. Among Canada’s larger cities, activity improved in Victoria, the Greater Toronto Area (GTA), Oakville-Milton and Ottawa, whereas it declined in Greater Vancouver, Edmonton, Regina, Saskatoon, London and St. Thomas, Sudbury and Quebec City.
Actual (not seasonally adjusted) sales activity fell 4.6% y-o-y to the weakest level for the month since 2013. It was also almost 12% below the 10-year average for March. That said, in British Columbia, Alberta and Saskatchewan, sales were more than 20% below their 10-year average for the month. By contrast, activity is running well above-average in Quebec and New Brunswick.
“It will be some time before policy measures announced in the recent Federal Budget designed to help first-time homebuyers take effect,” said Jason Stephen, CREA’s President. “In the meantime, many prospective homebuyers remain sidelined by the mortgage stress-test to varying degrees depending on where they are looking to buy. All real estate is local, and REALTORS® remain your best source for information about sales and listings where you live or might like to in the future,” added Stephen.
“March results suggest local market trends are largely in a holding pattern,” said Gregory Klump, CREA’s Chief Economist. “While the mortgage stress test has made access to home financing more challenging, the good news is that continuing job growth remains supportive for housing demand and should eventually translate into stronger home sales activity pending a reduction in household indebtedness,” he added.
The number of newly listed homes rose 2.1% in March. New supply rose in about two-thirds of all local markets, led by Winnipeg, Regina, Victoria and elsewhere on Vancouver Island. By contrast, new listings declined in the GTA, Ottawa and Halifax-Dartmouth.
With new listings having improved more than sales, the national sales-to-new listings ratio eased to 54.2% from 54.9% in February. This measure of market balance has largely remained close to its long-term average of 53.5% since early 2018.
Considering the degree and duration to which market balance readings are above or below their long-term averages is the best way of gauging whether local housing market conditions favour buyers or sellers. Market balance measures that are within one standard deviation of their long-term average are generally consistent with balanced market conditions.
Based on a comparison of the sales-to-new listings ratio with the long-term average, two-thirds of all local markets were in balanced market territory in March 2019.
The number of months of inventory is another important measure of the balance between sales and the supply of listings. It represents how long it would take to liquidate current inventories at the current rate of sales activity.
There were 5.6 months of inventory on a national basis at the end of March 2019, in line with the February reading and one of the highest levels for the measure in the last three-and-a-half-years. Still, it is only slightly above its long-term average of 5.3 months.

Housing market balance varies significantly by region. The number of months of inventory has swollen far above its long-term average in Prairie provinces and Newfoundland & Labrador; as a result, homebuyers there have an ample choice of listings available for purchase. By contrast, the measure remains well below its long-term average in Ontario and the Maritime provinces.
The Aggregate Composite MLS® Home Price Index (MLS® HPI) declined by 0.5% y-o-y in March 2019. It last posted a y-o-y decline of similar magnitude in September 2009. (Chart B)
Among benchmark property categories tracked by the index, apartment units were the only one to post a y-o-y price gain in March 2019 (+1.1%), while townhouse/row unit prices were little changed from March 2018 (-0.2%). By comparison, one and two-storey single-family home prices were down by 1.8% and 0.8% y-o-y respectively.
As of this release, the MLS® HPI now includes home sales via Okanagan-Mainline Real Estate Board’s MLS® System, which covers communities in the Okanagan Valley from Revelstoke to the Peachland region.
Trends continue to vary widely among the 18 housing markets tracked by the MLS® HPI. Results remain mixed in British Columbia, with prices down on a y-o-y basis in Greater Vancouver (-7.7%) and the Fraser Valley (-3.9%). Prices also dipped slightly below year-ago levels in the Okanagan Valley (-0.8%). By contrast, prices rose by 1% in Victoria and by 6.4% elsewhere on Vancouver Island.
Among Greater Golden Horseshoe housing markets tracked by the index, MLS® HPI benchmark home prices were up from year-ago levels in Guelph (+6.6%), the Niagara Region (+6.0%), Hamilton-Burlington (+3.7%) the GTA (+2.6%) and Oakville-Milton (+2.3%). By contrast, home prices in Barrie and District held below year-ago levels (-6.1%).
Across the Prairies, supply remains historically elevated relative to sales and home prices remain below year-ago levels. Benchmark prices were down by 4.9% in Calgary, 4.4% in Edmonton, 4.6% in Regina and 2.7% in Saskatoon. The home pricing environment will likely remain weak in these cities until demand and supply become more balanced.
Home prices rose 7.6% y-o-y in Ottawa (led by a 10.4% increase in townhouse/row unit prices), 6.3% in Greater Montreal (led by an 8.1% increase in apartment unit prices) and 2.1% in Greater Moncton (led by a 12.9% increase in apartment unit prices). (Table 1)
The MLS® HPI provides the best way to gauge price trends, as averages are strongly distorted by changes in the mix of sales activity from one month to the next.
The actual (not seasonally adjusted) national average price for homes sold in March 2019 was $481,745, down 1.8% from the same month in 2018.
The national average price is heavily skewed by sales in Greater Vancouver and the GTA, two of Canada’s most active and expensive markets. Excluding these two markets from calculations cuts close to $100,000 from the national average price, trimming it to just under $383,000.
– 30 –
PLEASE NOTE: The information contained in this news release combines both major market and national sales information from MLS® Systems from the previous month.
CREA cautions that average price information can be useful in establishing trends over time, but does not indicate actual prices in centres comprised of widely divergent neighbourhoods or account for price differential between geographic areas. Statistical information contained in this report includes all housing types.
MLS® Systems are co-operative marketing systems used only by Canada’s real estate Boards to ensure maximum exposure of properties listed for sale.
The Canadian Real Estate Association (CREA) is one of Canada’s largest single-industry trade associations, representing more than 125,000 REALTORS® working through some 90 real estate Boards and Associations.
Further information can be found at http://crea.ca/statistics.
For more information, please contact:
Pierre Leduc, Media Relations
The Canadian Real Estate Association
Tel.: 613-237-7111 or 613-884-1460
E-mail: pleduc@crea.ca